Keith Siilats
Version 06/13/2002
![]()
Executive Overview
This document is an overview of Portfolix (www.portfolix.com) an Enterprise tool for fixed income portfolio management.
The whitepaper will first give an overview of the particular functionality required by fixed income portfolio management tools viewed from the users perspective. Paper will then explore the existing OLAP technology implementations in a large data warehouse setting. Some examples will be given from CRM and other areas.
Finally I will show how OLAP is applied in particular by Portfolix to manage fixed income portfolios of any size. In particular, I will discuss how dimensions need to be grouped into two hierarchies: bond and account. I will also talk about the most important measure in a fixed income cube – the duration, and how OLAP is an extremely effective way to slice and dice duration automatically.
The paper will conclude with links to evaluation and demo software, which will allow you to read more about the topic and test some of the functionality of Portfolix/
Fixed Income Money management with $1bn+ size managers UP
There are about 200 money managers with over $1bn of assets under management in fixed income in the United States. The way they operate is by getting mandates from clients (normally in the thousands, each of which is few to few hundred million dollars in size) and will buy bonds with this money (normally a few thousand different ones at any given time). Now an account will typically contain a few hundred bonds, so most bonds are held in several accounts. Trading is done in lumps (say thousand bonds) that are then allocated to accounts (say to 10 different accounts, 100 units each).
Each account will have a benchmark, chosen by the client. There are about 10 standard benchmarks, but clients can create combinations of the standard ones (40% Lehman Mortgage, 60% Lehman Corporate). The benchmark is like an account that holds every single bond in existence. Now the accounts have to perform very similar to the benchmark, however, buying a small quantity of every bond is not practical because of transaction costs. So money manager task is to buy a few bonds to the account so that the account will mimic the behavior of the benchmark as closely as possible.
In order to do that all bonds are grouped together by some characteristic. Then as long as the account has the same weights in those characteristics as the benchmark, then the account will behave like a benchmark.
The most important characteristics are the credit rating of a bond (AAA), its sector (Utility) and its duration (5 years), although Portfolix includes more than 20 characteristics for different mortgage, corporate, paper, junk bond, different rating agency ratings etc. These will be called the bond based dimensions.
The account based dimensions are the portfolio managers, product lines, benchmarks and sub-benchmarks by common restrictions. Because there are too many accounts to look at them individually every day, the portfolio managers group accounts together and look at the averages in any group. If the average is too different from the benchmark, then they need to do trades.
The difference from the benchmark can either be viewed in terms of straight market value, the percentage weight or the duration difference. These are the measures in OLAP. Portfolix includes more than 15 measures including changes in durations over past quarter or month, minimum, maximum and average based rating measures, yield and effective durations etc.
Portfolio managers also view time series reports as to how the allocations have changed. They will also want to group accounts by restriction categories (accounts that limit high yield to maximum 10% for example) and whether they are in compliance or not.
Finally portfolio managers will take bets and differ the allocation from the benchmark. The view is normally expressed in terms of durational yield curve movements for example, and portfolio managers will need a way to translate this into the bond quantities that need to be bought or sold.
UP
Duration is essentially a measure of how sensitive the bond price is to the movements in the interest rate. As interest rate is normally exogenous, then 1000 bonds with duration of 2 are about as risky as 2000 bonds with duration 1, so they are given similar weighting in portfolios. Mathematically, duration is the partial derivative of bond price with respect to the interest rate expressed as a percentage. Bonds with longer maturity have longer duration (because if the interest rate rises you are expected to get a higher return for longer time, however, because the final payback amount of the bond is always specified, the price will drop more) however, duration is normally less than the time to maturity because some part of the bond is paid before in coupons.
Technology Primer on Microsoft.NET/OLAP
UP
Since 1980-s most actions, like buys and sells are recorded in a transactional SQL based system. It can store numbers and textual data. OLAP is a system on top of these servers (OLTP servers) that became into wider use first in 1995. There are number of OLAP vendors, most notably Hyperion and Cognos (www.olapreport.com).
Most portfolio managers use excel extensively for managing their ideas. However, it is hard to automate or "productionize" excel and hard to integrate it with SQL servers from large vendors like Sybase, Oracle and DB2.
So Microsoft released his own version of SQL server and a host of other servers inside its .NET strategy. Within a year those have become the fastest servers in the market (www.tpc.com), most widely implemented and cost effective. They integrate very well with excel and other office tools.
Portfolix is build on top of Microsoft Analysis Server, the OLAP server that comes with Microsoft SQL server
license ($1500 dollars and up, www.microsoft.com/sql). However, it does not need the Microsoft SQL server to operate, any server will do and indeed Portfolix has been implemented on Oracle as well as Sybase.
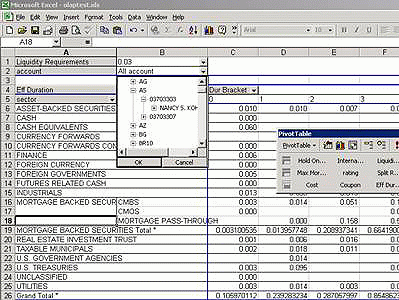
OLAP is thus a server that deals with data. Whereas SQL organizes data in a relational format in tables, OLAP organizes data into multidimensional cubes consisting of dimensions and measures. SQL tables look like an excel sheet with data, Cubes are like PivotTables in excel that are hierarchical and contain lots of calculations and access the data from underlying relational database.
Why OLAP is so successful is that is extremely flexible and has very high performance. It pre-calculates most of the "interesting" numbers and then uses those intermediate numbers to calculate the answers to business questions. In technical terms, a standard database has to recalculate every "group by" query whereas OLAP server stores aggregations.
In addition, by modeling only dimensions and measures, the end user is later on allowed to combine them visually in excel into any type of report. With straight OLTP type systems one will have to use Microsoft Query type SQL editing tool which has a lot steeper learning curve and smaller performance.
Finally Portfolix is also a set of data warehouse technologies which support OLAP and are popularized by Kimball books. Portfolix makes business data into 5th normal form and snowflake schema. It also adds scheduling and automatic data validation routines.
Clearly OLAP server is an additional computer with additional administrative costs so it is not suitable for everyone. If the present SQL database is fast enough and the excel reports are not too big and there is no need to source control and document multiple developers, then there are few benefits to learning OLAP. In practice the portfolios of over $1bn will clearly benefit from OLAP, $100m to $1bn will probably benefit and for portfolios less than $100m it is less clear that they will benefit.
Portfolix extensions for fixed income OLAP
UP
There are no successful OLAP implementations in Fixed Income so far because of the complexity in calculating duration based measures and the non-aggregatable features of cubes that require aggregations of accounts to be treated differently from aggregations of bonds (averages
vs. sums). However with extensive industry background and groundbreaking research from AST members in NYU Courant Mathematics Institute, members of AST were able to solve those problems very elegantly creating a fast, flexible and self documenting system of cubes. Those cubes with the data warehouse design and maintenance tools form the core of Portfolix.
So in order to effectively manage fixed income accounts against a benchmark one needs to be able to slice and dice the data. Real-time slicing and dicing using traditional OLTP (SQL servers) is extremely slow. OLAP is then a hierarchical database solution created to facilitate fast real-time slicing of very large databases.
What is the current situation in companies?
UP
Developer and extending Portfolix. UP
Portfolix is easily extendible by in-house developers.
OLAP implementation consists of 3 parts: SQL server, OLAP server and Excel sheets. SQL server part needs to be created (probably looking like "views" of your existing database), the OLAP fixed income cubes will be licensed out of the box, and similarly the server that does nightly processing and standard excel reports. Portfolio managers will then customize the Excel reports to suit their reporting needs.
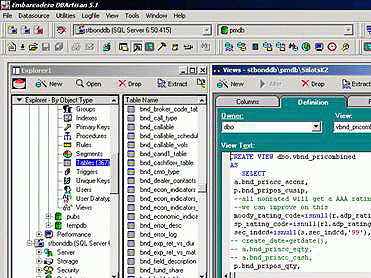
1. SQL Server Part:
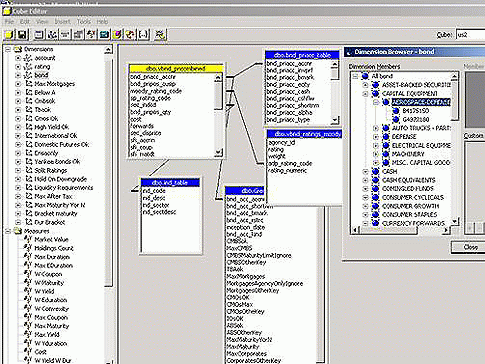
2. OLAP server part:
3. Excel, Visual Basic applications, Web pages and other reporting part: UP
¨
Excel PivotTables
¨
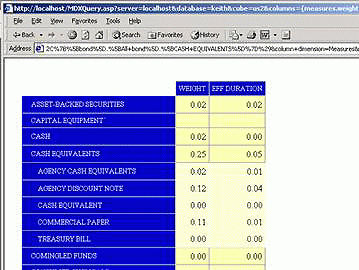
Web based interfaces (ASP, JSP)
¨
MDX query displaying clients (Cognos, Intellibrowser)
Contents of the Portfolix Cubes
¨
Accounts – real time account information
¨
Yields – real-time yield curve + historical information by ratings and sectors
¨
HistoricAccounts – a monthly snapshot of the account data allowing plotting of timeseries of sector weights, differences from benchmark
etc.
Dimensions
¨
Account Based Dimensions
¨
by team (growth portfolios) and portfolio manager
¨
by benchmark, sub benchmark, account number and name
¨
by restriction Categories
¨
Allow Junk,
¨
Allow CMBS,
¨
Allow International
¨
Allow Split Ratings
¨
Etc
¨
Security Based Dimensions
¨
Single Security
¨
Bond adp/bond cusip/bond issuer– various informational convenience breakdowns
¨
Bond duration
¨
Bond maturity
¨
Bond Ratings
¨
Bond rating (Moody’s)– starts from investment grade/non investment grade/treasury, goes down to A/AA/B and then down to the actual
rating, then to issuer and finally cusip
¨
Bond rating min and max same as above, except instead of moody it uses minimum rating.
¨
Bond sector, starts from top level, like spread product and cash and breaks down to industry level
¨
Bond country – this includes the development index as top level allowing
to separate out developed and non developed countries
¨
Bond currency – starts from us / non-us distinction
¨
Mortgage sector specific
¨
loan types (i.e., agency)
¨
term (30, 15, 7)
¨
production
¨
coupon buckets
Measures
UP
¨
Market value (account or security)
¨
Par amount (security)
¨ Original Face – (security - some of this data is suspect (and not just for
mortgages))
¨
Eduration (weighted effective duration) - (account or security)
¨
Yduration (weighted spread duration) - (account or security)¨ Weight –
(security)
¨
Ratingmoody, rating sp, rating average, rating min, rating unrated market
value
¨
Leverage is market value of leverage less than 1 year and Us bond
¨
Last_update – when the cube was last updated, in mmdd format
¨
Holding count – how many positions
Sample Canned reports
UP
¨ Duration bucketing
¨
Rating distribution
¨
Sector distribution
¨
Individual Positions
¨
Mortgage Report
References and further reading